
A housing ranking got our attention. The other signals told a bigger growth story.
TL;DR
Why are so many of the top U.S. new-construction metros in the Southeast?
Local housing supply matters, but the broader data points to a larger mix of population growth, migration, affordability, job creation, industrial investment, and available land. Eight of Realtor.com’s top 10 metros for new construction in 2026 are in the South, including six in the Carolinas and two in Tennessee.
Does new-home construction tell us where jobs and industries are growing?
Partly. Housing construction can reflect growth already underway, but it measures a different part of the economy than company investment, hiring, migration, or industry expansion.
What other data can help identify growing metros earlier?
Company capital announcements, site development, supplier expansion, out-of-market home searches, one-way moving data and job commitments can all appear before population and tax migration data fully confirm the change.
Which data sources tend to lead growth, and which ones lag?
Corporate investment, facility announcements, site preparation, and some housing-search behavior can appear early. Census population estimates and IRS migration data are stronger confirmation signals because they tell us what actually happened after people and money moved.
Did the broader data uncover markets outside Realtor.com’s top 10?
Yes. Greensboro, Raleigh and Knoxville are especially interesting because separate datasets are picking up economic development, migration or housing-demand signals before all of them appear together in a top-10 ranking.
Is the Southeast growth story driven by one industry?
No. South Carolina has a heavy footprint in manufacturing, automotive, aerospace, and energy. North Carolina adds aerospace, life sciences, technology, and financial services. Tennessee combines automotive and advanced manufacturing with healthcare, energy, and a growing nuclear technology cluster.
What does this have to do with hiring?
Industry can expand faster than a local specialized talent pool. Employers entering or expanding in growth markets often need to uncover hard-to-find local talent, consider transferable backgrounds, or recruit people who are genuinely prepared to relocate.
We started with a housing story in our own backyard
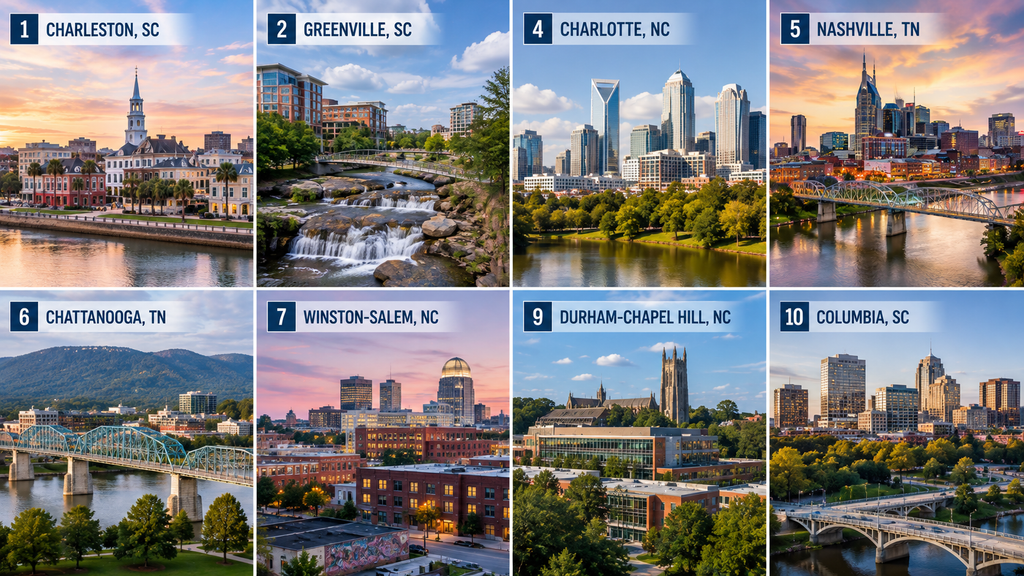
Realtor.com released its 2026 ranking of the best U.S. metros for buying a newly built home, and it was hard for us not to notice the map.
Charleston ranked first.
Greenville ranked second.
Then came Charlotte at fourth, Nashville at fifth, Chattanooga at sixth, Winston-Salem at seventh, Durham-Chapel Hill at ninth, and Columbia at tenth.
Eight of the top 10 sit in three neighboring states: North Carolina, South Carolina and Tennessee. Six are in the Carolinas alone.
As a South Carolina company, there is plenty for us to like about seeing Charleston, Greenville and Columbia on the list. Zoom out another step, and the regional concentration becomes more interesting. The Carolinas and Tennessee form a large connected stretch of the Southeast with different economies, different major employers, and different population centers, yet all three keep appearing in growth data.
That is where our curiosity changed.
We wanted to know what the ranking was really telling us.
Realtor.com’s ranking measures one important part of the story
Realtor.com’s methodology is useful because it goes well beyond counting houses.
The study scores the 100 largest U.S. metros using four factors:
- New construction as a share of homes listed for sale
- The price difference between new and existing homes
- Climate-risk differences between new and existing homes
- Buyer interest and time on market for new homes
That makes it a useful measure of where new-home buyers currently have a favorable mix of supply, price, and demand.
It also raised another question for us.
What happens when we compare that housing signal with completely different data?
Economists already track GDP, payroll growth, unemployment, wages, inflation, industrial production, housing starts, building permits, consumer spending, and dozens of other established indicators. Those measures are essential for understanding the economy.
Our question was more tactical.
If you are trying to see where industries, workers, and hiring demand may be moving next, are there other signals hiding between those reports?
The first cross-check made the regional pattern stronger
Population data gave us one of the cleanest confirmations.
According to the Census Bureau’s 2025 estimates, North Carolina added about 146,000 residents in one year, the third-largest numeric gain in the country. South Carolina added nearly 80,000 and Tennessee roughly 64,000.
Measured by percentage growth, South Carolina ranked first nationally at 1.5%. North Carolina ranked third at 1.3%. Tennessee grew 0.9% and also finished in the national top 10.
Three neighboring states appeared in the same national population-growth table.
The Census data also found something important happening beneath the state totals. From 2020 through 2025, metro counties in the South grew 6.7%. Outlying counties around Southern metros grew especially quickly across multiple age groups.
That lines up with what Realtor.com sees in places like Summerville outside Charleston, Piedmont and Fountain Inn around Greenville, Huntersville outside Charlotte, and the suburban communities connecting the Triangle.
The housing growth is spreading around employment centers rather than staying inside the traditional city core.
People searching and moving give us a different kind of signal
Housing searches can show interest before a move happens.
Realtor.com’s second-quarter 2026 research found that 67.2% of views on new-construction listings nationally came from outside the property’s metro area.
The regional examples were telling.
People viewing new construction in Charleston were commonly coming from Atlanta, New York, and Washington. Greenville drew outside interest from Atlanta, New York, and Charlotte. Durham drew heavily from Raleigh, Washington, and Atlanta.
Charleston had 77.2% of its new-construction views coming from outside the metro.
A page view does not equal a future resident. It does tell us where people are looking.
Moving-company data gets one step closer to an actual relocation.
U-Haul’s 2025 Growth Index had Charlotte, Nashville, Charleston, and Raleigh among its 10 metros with the greatest net gains of one-way customers.
That overlaps Realtor.com’s list, but it also introduces Raleigh. Raleigh missed the new-construction top 10 and landed in Realtor.com’s honorable mentions.
United Van Lines found another version of the same regional pattern. South Carolina ranked third among its inbound states in 2025, and North Carolina ranked seventh. Wilmington, North Carolina had an 83% inbound share among United’s tracked moves.
Tennessee did not make United’s top inbound-state ranking.
That matters.
Independent datasets should disagree sometimes. U-Haul customers, United Van Lines customers, home shoppers, and Census residents are different populations. When several datasets point toward the same place, the signal becomes more interesting. When they diverge, that can be useful too.
The three states are getting growth through different industries
A regional pattern does not require one regional economic story.
South Carolina, North Carolina, and Tennessee show why.
South Carolina: The state announced $9.12 billion in capital investment and more than 8,100 new jobs from economic development projects in 2025. Greenville County alone reported $725 million in investment and 1,293 new jobs, including Isuzu’s new U.S. manufacturing base, GE Vernova investment, data-center expansion, and advanced manufacturing projects. Around Columbia, Scout Motors’ $2 billion Blythewood production operation carries a commitment of 4,000 or more permanent jobs and is already attracting suppliers.
North Carolina: The state recorded more than 35,000 announced job commitments and more than $24 billion in capital investment in 2025, both record levels. The mix included aerospace, life sciences, advanced manufacturing, and supply chain operations. The biggest example is Greensboro, where JetZero broke ground in June 2026 on a $4.7 billion aircraft manufacturing operation tied to more than 14,500 planned jobs.
Tennessee: The signals are spread across several industries and metros. Middle Tennessee continues to add manufacturing and energy operations, including a 2026 Create Energy expansion expected to create more than 1,000 jobs. East Tennessee is developing a concentrated nuclear and advanced-energy cluster around Oak Ridge. LIS Technologies announced a $1.38 billion uranium-enrichment project, Centrus announced more than $560 million for centrifuge manufacturing, TRISO-X announced 1,140 jobs and a planned investment in the hundreds of millions, and Kyoto Fusioneering announced a new U.S. headquarters and fusion testing operation.
The housing outcome can look similar while the underlying hiring demand looks completely different.
Charleston may need aerospace, automotive, and port-related talent. Greensboro may need aerospace manufacturing workers and engineers. Oak Ridge may need nuclear engineers, scientists, technicians, and advanced manufacturing talent. Charlotte can grow through finance, corporate operations, and technology.
The industry signal matters as much as the metro signal.
The most interesting markets may be where the datasets disagree
This was where the exercise became more useful to us.
A top-10 list identifies markets where several housing conditions already line up. If we are looking for earlier signals, some of the more interesting places may sit just outside that list.
Greensboro-High Point is a good example.
Realtor.com lists Greensboro as an honorable mention rather than a top-10 new-construction metro. New construction makes up 28.6% of its active listings and page views per new-construction listing run 12.8% above the national average.
Then the economic development data arrives.
JetZero’s Greensboro project alone calls for $4.7 billion in investment and more than 14,500 jobs.
A project of that scale changes the question. Housing data may eventually reflect the employment change, but the job commitment has already arrived.
Knoxville is another.
Knoxville also sits in Realtor.com’s honorable mentions. Only 18.9% of its listings are new construction, but page views on those homes run 87.9% above the national average.
Now layer in Oak Ridge, which is part of the broader Knoxville labor market.
LIS Technologies, Centrus, TRISO-X, and Kyoto Fusioneering have announced major nuclear and fusion projects there in 2026. Those projects span fuel, enrichment, centrifuge manufacturing, research, and fusion testing.
Housing search interest and specialized industry investment are appearing in the same market at roughly the same time.
That deserves attention.
Raleigh shows a different combination.
Raleigh-Cary has a 41.9% new-construction share, one of the highest figures among Realtor.com’s honorable mentions. U-Haul separately put Raleigh in its national top 10 for net one-way customer gains in 2025.
Its Realtor.com page-view figure is 19.1% below the national average, however.
That mixed result is useful. Strong construction supply and moving activity can exist without unusually high listing engagement on one platform at one moment in time.
Looking nationally keeps us from forcing a Southeast story onto the data
The same cross-check works outside the Carolinas and Tennessee.
Boise ranks third and Madison eighth in Realtor.com’s top 10, immediately showing that the housing conditions behind the ranking are not exclusive to the Southeast.
Dallas gives us an even better example of why the datasets need context.
Dallas-Fort Worth ranked first in U-Haul’s 2025 Growth Index for net one-way customer gains. Realtor.com places Dallas in its honorable mentions rather than the top 10. New construction makes up 31% of listings there, but new homes carry a 9.8% premium and listing page views run 9.5% below the national average.
Dallas can be a major growth market while failing to score as one of the country’s 10 best places to buy a new home.
Those statements measure different things.
Portland, Maine shows the opposite problem with relying too heavily on buyer interest. New-construction listings there receive page views at 359.5% above the national average, the highest figure among Realtor.com’s honorable mentions. New homes account for only 14.4% of listings and carry a 15.2% premium over existing homes.
Search interest is a signal. Supply and affordability change what that signal means.
Growth signals appear at different points in the cycle
This became the most useful finding from the exercise.
Different datasets are taking pictures of the same economic process at different moments.
A simplified sequence might look like this:
Early signals
- States and communities prepare industrial sites.
- Companies announce facilities and capital investment.
- Suppliers begin following major employers.
- Companies announce hiring targets and begin recruiting.
- Specialized job postings start appearing.
Behavior signals
- People outside the market begin searching for homes.
- One-way moving traffic starts shifting.
- Relocation patterns change by age, income, or origin metro.
Market response
- Builders add housing inventory.
- New construction spreads into surrounding counties.
- Home pricing and concessions adjust.
- Local employers compete harder for specialized workers.
Confirmation signals
- Census population estimates record the residents who arrived.
- Employment data catches the larger labor-market shift.
- IRS migration files eventually show which tax filers moved and how much income moved with them.
The timing difference can be substantial. The newest IRS county-to-county migration dataset available in 2026 covers address changes from 2022 to 2023.
That makes IRS data valuable confirmation. It makes it a poor early-warning system.
Company announcements can have the opposite weakness. A company can announce a project years before full employment arrives, and some projects change scope.
No single source solves the problem.
We would rather use a signal stack than create another ranking
It would be easy to turn this into a “Top 10 metros to watch” list.
We do not think the data supports that yet.
Comparing these sources does suggest a more useful way to think about a market. We would want to see several independent types of evidence stacking together:
- Industry investment: Are companies committing real capital?
- Future jobs: Are those investments tied to meaningful employment?
- Industry concentration: Do the projects build on an existing talent and supplier base?
- Housing capacity: Can the metro actually absorb more households?
- Search behavior: Are people outside the metro looking there?
- Physical migration: Are movers starting to arrive?
- Affordability: Does the market still offer enough purchasing-power advantage to attract workers?
- Population confirmation: Is official population data moving in the same direction?
The combination matters more than any one metric.
Greensboro becomes interesting because a housing honorable mention sits beside the largest job commitment in North Carolina history.
Knoxville becomes interesting because unusually high housing-search activity sits beside a fast-growing nuclear and advanced-energy cluster.
Raleigh becomes interesting because strong new-home supply and U-Haul migration appear together, even while one housing-demand measure looks cooler.
Dallas reminds us that a powerful migration market does not automatically offer the country’s best new-home economics.
That is the kind of disagreement we want to find.
Industry growth also tells us what kind of talent pressure may come next
A metro can gain population without creating much demand for the kind of talent we recruit.
The industry layer changes that.
A $4.7 billion aircraft manufacturing project in Greensboro points toward manufacturing engineering, aerospace engineering, quality, supply chain, automation, skilled production, and plant leadership.
Nuclear investments around Oak Ridge point toward nuclear engineering, materials science, controls, advanced manufacturing, technical operations, and highly specialized scientific talent.
Automotive growth around Columbia and Greenville affects controls engineers, maintenance technicians, manufacturing engineers, quality professionals, supply chain teams, and technical leadership.
Life sciences and technology expansion in North Carolina creates a very different labor problem from automotive manufacturing in South Carolina.
This is why “fast-growing metro” is too broad to be a hiring strategy.
The useful question is: What is growing there, how quickly is it growing, and does the local talent base have enough of the people that industry needs?
Sometimes the talent is there, but it is hidden. Finding those people can require sourcing approaches that come from knowing the industry, the companies, the adjacent skill sets, and where people with that experience tend to sit.
Sometimes the local talent pool simply is not deep enough.
Then the conversation changes. Which backgrounds are transferable? Which nearby industries produce similar skills? Which metros should we search? At what point does relocation become necessary?
Those decisions are easier when they happen before every employer in the market starts chasing the same limited group of people.
Relocation is really a motivation question
Relocation sounds simple when reduced to a line on a job description.
It rarely is.
We sometimes hear some version of, “I’ll live anywhere if the money is right.” In our experience, that is rarely the foundation for a good placement.
Everybody has things that matter outside of work.
The recruiting work is understanding what those things are. A candidate may care about being near family, a spouse’s career, schools, outdoor access, housing, airport access, commute length, church, community, climate, or something completely different.
Knowing that changes how you evaluate a location.
It also changes how seriously you take someone’s willingness to move.
A good relocation conversation gets specific:
- What would the move actually look like?
- Are all of the decision-makers in the household on board?
- Has the candidate talked with a real estate agent about selling a home?
- What kind of commute have they lived with before?
- Have they researched the housing market?
- What does their spouse or partner need?
- What parts of their current community would they want to replace?
- Have they actually thought through the timing?
Someone does not need a pre-existing connection to Greenville, Greensboro, Knoxville, or any other metro for relocation to work.
Their reasons for considering the move do need to make sense.
Understanding what makes someone tick outside of work can reveal that a city they had never considered is a strong fit. It can also reveal when somebody likes the job but hasn’t really thought through the move.
Finding the people can become the harder half of the growth story
Metros can add facilities, houses and residents faster than they add experienced controls engineers, aerospace manufacturing leaders, nuclear specialists, scientists or technical operators.
Sometimes the talent already lives there, and the challenge is finding it. Domain knowledge matters because the best candidates do not always have the obvious title, work for the obvious company, or show up in the obvious search.
Sometimes the answer is an adjacent industry or another metro where the skills transfer.
Sometimes it is relocation.
All three require more than matching a resume to a job description. They require understanding the market, the work, the candidate’s motivation, and how thoroughly everyone involved has thought through the decision.
That is the approach STEM Search Group brings from our executive search and retained search roots into niche individual-contributor searches as well. We use research, market mapping, proactive sourcing, transferable-skill analysis, and detailed relocation conversations whether the need is a plant leader, controls engineer, materials scientist, or another hard-to-find specialist. Growth can create opportunity quickly. The local talent pool does not always expand on the same schedule.
Sources
- Realtor.com: Where new construction thrives, top metros for 2026
- Realtor.com: New-construction insights, Q2 2026
- Realtor.com: 2026 state report cards for homebuilding and affordability
- U.S. Census Bureau: 2025 population estimates
- U.S. Census Bureau: Population growth by region and county type, 2020 to 2025
- U.S. Census Bureau: Metropolitan population estimates, 2020 to 2025
- U-Haul: 2025 Growth Index, top U.S. metros and cities
- U-Haul: 2026 midyear metro migration trends
- United Van Lines: 2025 National Movers Study
- IRS: Statistics of Income migration data
- Bureau of Economic Analysis: Regional price parities and real personal income
- North Carolina Department of Commerce: 2025 economic development results
- North Carolina Department of Commerce: JetZero Greensboro groundbreaking
- South Carolina Governor’s Office: 2025 industry recruitment results
- Greenville Area Development Corporation: 2025 investment and job announcements
- South Carolina Department of Commerce: Scout Motors Blythewood project
- Tennessee Department of Economic and Community Development: Create Energy expansion
- Tennessee Department of Economic and Community Development: LIS Technologies Oak Ridge investment
- Tennessee Department of Economic and Community Development: Centrus Oak Ridge expansion
- Tennessee Department of Economic and Community Development: TRISO-X Oak Ridge expansion
- Tennessee Department of Economic and Community Development: Kyoto Fusioneering Oak Ridge project