
Five million industrial robots are running. Is the bigger story what comes next?
TL;DR
How many industrial robots are operating worldwide?
About 5 million industrial robots were operating in factories worldwide at the end of 2025, according to the International Federation of Robotics (IFR), up from 3 million in 2020. The installed base has more than doubled in seven years.
How many new industrial robots are being installed?
Factories installed more than 600,000 industrial robots in 2025, a record and the fifth straight year above 500,000, with China accounting for 59% of them. IFR forecasts about 655,000 installations in 2026 and 806,000 a year by 2029.
Why is the 5 million mark significant?
Five million shows the scale industrial automation has reached. Manufacturers now add hundreds of thousands of robots a year to the millions already running, expanding the need for integration, maintenance, uptime, software, data, safety, and technical talent.
Where is automation having the greatest impact?
Material handling, warehousing, machine tending, palletizing, welding, assembly, packaging, inspection and quality lead the list. These are areas where automation can address repetitive work, staffing gaps, safety, ergonomics, consistency, and throughput.
Are robots actually getting cheaper?
The clearest evidence of falling cost is in deployment, since robot hardware prices vary too much by payload, application, and supplier to generalize. Easier programming, reusable engineering, integrated vision, simulation and standardized applications can cut the cost and time of putting a robot into production.
Does automation mean fewer manufacturing jobs?
Some tasks will need fewer people: the U.S. Bureau of Labor Statistics (BLS) projects production occupations to shrink 0.4% from 2025 to 2035. Several occupations that keep automated production running are projected to grow far faster than the 3.5% overall rate, including industrial machinery mechanics (18%), industrial engineers (12%), and mechanical engineers (11%).
Do robot statistics capture everything happening right now?
No. Installation data count projects that have already reached deployment, so they miss the discussions inside plants, executive teams, and boardrooms about turnover, labor availability, safety, quality, capacity, and how future factories should operate.
Five million industrial robots now operate in factories worldwide. The number caught our attention, but its trajectory and the trends around it tell a bigger story.
The yearly percentages undersell what’s happened. Installations dipped in 2019 and 2023, held roughly flat in 2024, and jumped 11% in 2025. Read one year at a time, that looks like an ordinary cyclical industry. Look at the level and the running total instead, and a different picture emerges.
In 2015, manufacturers worldwide installed about 254,000 industrial robots. Every year since 2021, they have installed more than 500,000, a threshold IFR’s own 2021 outlook did not expect the market to reach until 2024. In 2025, installations passed 600,000 for the first time. Factories installed more than 2.2 million robots from 2022 through 2025 alone, and IFR expects about 655,000 installations in 2026 and 806,000 a year by 2029.
The installed base tells the same story. It reached 3 million in 2020, passed 4 million in 2023 and hit 5 million in 2025, more than double the level of seven years earlier. Industrial robots have worked in factories since the early 1960s, yet the operating base added more robots in those seven years than it had accumulated in the nearly six decades before. That move from steady adoption to a much higher, sustained level is the inflection point. It is happening as robotics becomes more connected to machine vision, artificial intelligence, industrial networks, manufacturing software, simulation and digital twins.
The question that interests us now is what happens next.
Five million changes the operating math
Evaluating one robot for one application is fairly straightforward. Once a plant runs dozens or hundreds of automated assets, the calculation gets harder. The return on each robot still counts, and so do maintenance, uptime, integration, technical talent, safety, software, cybersecurity, and the ability to support it all for years.
At that scale, companies need spare-parts strategies, programming and engineering standards, backups, preventive maintenance, vendor support and recovery plans. Manufacturers with several plants face a second question: how much should be standardized across locations, from equipment and controls to data, software and engineering practices?
A successful demonstration or pilot is only the beginning. Rockwell Automation’s 2026 State of Smart Manufacturing report found that 59% of manufacturers now actively use smart manufacturing technologies in daily operations, while 18% remain in pilot mode. The harder test comes after the pilot: keeping automation reliable through years of production, equipment changes, software updates, and new technology. As a plant adds automation, the economics depend increasingly on how well it can operate and support the entire system, and the payback on the next robot becomes one input among many.
China has changed the scale of the market
China installed about 354,000 industrial robots in 2025, a 20% increase from the year before and 59% of worldwide installations. Chinese suppliers provided about 195,000 of those robots, up 15%, which gave them 55% of their home market (down slightly from 57% in 2024).
Large production volumes let manufacturers spread engineering costs, build larger application libraries and deepen domestic component supply chains. Chinese suppliers are doing that inside a country that now installs more industrial robots than the rest of the world combined.
Pricing is harder to generalize. We could not find good audited evidence showing that Chinese robots are consistently 20%, 30%, or some other fixed percentage cheaper than comparable FANUC, ABB, Yaskawa, or KUKA equipment. Payload, reach, controller, application, warranty, service, and geography can change the comparison considerably.
The data clearly shows a huge domestic robotics market where Chinese suppliers are selling more robots every year, even as foreign suppliers regained a little share in 2025.
The U.S. market is broadening beyond automotive
The United States moved into second place among the world’s industrial robot markets in 2025. U.S. installations rose about 12% to roughly 38,400, the third-highest total in IFR’s records, while installations in Japan fell about 19% to approximately 36,200.
Automotive remains the largest U.S. robot market, but it did not drive the increase. Automotive installations slipped 1% to about 13,500, while food and beverage installations jumped 30% to 2,900. IFR also reported growth in warehousing, logistics and medical applications.
North American order data from the Association for Advancing Automation (A3) show the same broadening. Companies ordered 36,766 robots worth $2.25 billion in 2025, up 6.6% in units and 10.1% in value, and general industries accounted for the majority of units ordered. Growth has slowed in 2026 so far: first-half orders reached 17,995 units worth $1.166 billion, up 2.0% in units and 6.6% in value.
That growth spreads automation across a wider range of applications. Welding a vehicle body, palletizing cases of food, tending a CNC machine, inspecting a medical device, and moving material through a warehouse can all involve industrial automation, yet the economics, technical requirements, and business case for each can look very different.
Some applications make a stronger automation case
The economics vary by process, but certain applications combine traits that make automation easier to justify: repetitive work, measurable cycle times, hard-to-staff positions, ergonomic concerns, high utilization and costly quality variation.
Material movement is an obvious example. Palletizing, depalletizing, picking, staging, and internal transport can consume a great deal of labor without changing the product itself. Industrial robots perform some of this work, while automated guided vehicles (AGVs) and autonomous mobile robots (AMRs) handle other portions. Many of those mobile systems fall outside IFR’s five-million industrial robot count, so the headline number captures only part of the broader factory automation market.
Machine tending presents a similar opportunity. Loading and unloading CNC machines, presses, and other production equipment can be highly repetitive, especially across multiple shifts. If automation lets one employee supervise several processes instead of repeatedly loading one machine, the calculation can include both labor and better utilization of production equipment.
Quality may become one of the more interesting areas to watch. Machine vision and AI keep expanding what automated inspection systems can identify and measure, and Rockwell’s 2025 survey found quality control was manufacturers’ top AI use case for the second year running, with 50% planning to apply AI or machine learning to product quality. Better inspection can reduce scrap and rework, improve traceability, limit warranty exposure, and give engineers more production data to find problems earlier. A system that inspects every part creates a different quality process than one built around periodic manual inspection.
Then there are the jobs companies simply struggle to keep staffed. Repetitive, physically difficult, or undesirable work can cost far more than the hourly wage suggests, especially when turnover stays high.
The hourly wage misses much of the labor cost
A capital request comparing a $25-per-hour employee with a robot can look straightforward on paper. Anyone who has dealt with a chronically difficult position knows how incomplete that comparison can be.
The company may have paid to advertise the opening, source candidates, conduct interviews and background checks, and put a new employee through orientation and training. Supervisors and experienced workers spend time getting that person productive, while overtime or temporary staffing covers the vacancy. When shortages get severe enough, production slows, or a line doesn’t run at all. At that point, the cost extends well beyond the open position.
Benefits, PPE, safety training, absenteeism, and workers’ compensation exposure add other costs depending on the job. If the employee leaves six months later, much of the recruiting, training, and ramp-up cycle starts again.
No universal percentage captures all of this. Plant leaders, HR teams and finance departments usually know which positions they keep refilling, where overtime has become routine and which staffing gaps can affect production.
Automation has its own costs and risks. Robots need maintenance, power, spare parts, and technical support, and OSHA’s lockout/tagout requirements still apply when employees service robots with hazardous energy sources.
For processes with chronic turnover or staffing shortages, the calculation goes beyond replacing an hourly wage. Avoiding repeated hiring and training costs can improve the economics, and keeping production running when there aren’t enough people to staff it can change the calculation considerably.
Labor availability may be a bigger pressure than wage inflation
Rising wages show up in almost every automation business case. Availability may be the more persistent problem, and IFR itself names labor shortages, along with reshoring and supply-chain relocation, as a driver of future robot demand.
A plant still has to staff production every day. Automation becomes more attractive when a process is chronically difficult to fill, turnover stays high, absenteeism disrupts output, the work creates ergonomic or safety concerns, or additional production would otherwise require another shift.
Rockwell Automation’s 2025 State of Smart Manufacturing report, based on a survey of more than 1,500 manufacturers in 17 countries, offers a useful view into that thinking. Forty-one percent of respondents said they are using AI and automation to help close skills gaps and address labor shortages. At the same time, 48% plan to repurpose or hire additional workers because of their smart manufacturing investments.
The boardroom calculation can therefore span labor, capacity, throughput, consistency, quality, safety, and the risk of being unable to staff production when customers need it.
A robot and an automation system carry different price tags
Hardware price creates another easy misunderstanding. The robot’s price may be only one part of what a manufacturer spends before the application produces anything.
A completed system can require end-of-arm tooling, fixtures, machine vision, sensors, safety equipment, PLC controls, electrical work, software, networking, installation, programming, commissioning, validation and training. The exact mix depends heavily on the application.
A3’s North American order data provide useful context. The 36,766 robots ordered in 2025 were worth $2.25 billion, or roughly $61,000 per robot. Collaborative robots (cobots) accounted for 7,212 orders worth $241 million, roughly $33,000 each, and made up 19.6% of all units ordered. Those figures describe robot orders alone; a completed automation cell costs more.
NIST research with manufacturing experts found that development, fixturing, tooling, and integration can add substantially to the hardware investment. Experienced integrators cited in that work suggested small and medium-sized manufacturers budget around three times the price of a cobot system to cover integration, although other experts’ estimates differ. A relatively inexpensive robot can become a much larger capital project by the time it produces its first good part.
Deployment may be getting cheaper faster than the robot itself
Industrial robotics has a legitimate cost-deflation story, and much of it is happening around the robot. Programming tools have become easier to use, preconfigured cells can reduce custom engineering, and machine vision is increasingly built into automation platforms. Offline simulation moves some programming and debugging off the production floor, while reusable software and more common interfaces shorten the work of connecting systems. IFR quantifies part of this: experts it cites estimate that model-based programming through graphical interfaces built for non-programmers can save up to 75% of installation time and cost.
Experience compounds those savings. A manufacturer deploying its tenth palletizing cell brings knowledge, code, standards, and operating experience that did not exist when it deployed its first. The engineering team has already learned what tooling works, how the equipment communicates, where previous installations struggled, and how operators and maintenance teams will interact with the cell.
The economics can improve without every robot arm getting dramatically cheaper. Reducing engineering hours, integration work, commissioning time, and production disruption can raise returns just as much.
A short payback is possible when the process fits
Robot payback numbers are easy to oversell. In the NIST work, experienced cobot integrators put typical ROI at around 14 months for suitable applications, which makes a 12 to 18 month payback reasonable in the right setting. Treat that range as a reference point for well-chosen projects, since results vary widely outside them.
Stable processes generally make better candidates because the robot isn’t constantly being reconfigured for changing products or geometry. Utilization counts too. Equipment running across several shifts has more opportunities to create value than a robot used sporadically.
Good projects also start with a measurable baseline. A manufacturer needs to understand current cycle time, labor, scrap, quality, and throughput before it can credibly calculate improvement. Integration and safety requirements belong in the same calculation, because a seemingly simple task can become expensive when surrounding equipment needs extensive modification.
A robot can be excellent equipment inside a bad automation project. The process, utilization, and surrounding system determine whether the investment pays.
The employment data shows another side of automation
The popular discussion about robots and employment usually starts with the jobs a machine might replace. That part of the story is real. The BLS projects employment in production occupations to decline 0.4% from 2025 to 2035, partly due to the continued deployment of automated machinery and processes in manufacturing. Manufacturing employment as a whole is projected to grow only 0.6%, compared with 3.5% for the full economy (BLS occupation pages round that economy-wide rate to 3%).
The engineering side looks very different. Industrial engineers, the BLS category that includes manufacturing engineers, are projected to grow 12%, adding about 45,400 jobs. About 40% of industrial engineers work in manufacturing industries such as transportation equipment, computer and electronic products, machinery and fabricated metal products, and BLS points to demand for expertise in production optimization, supply chains, logistics, and automation. Mechanical engineers are projected to grow 11%, and BLS expects more complex automation machinery to require them to integrate that equipment into existing systems.
The maintenance numbers are even stronger and sit closest to the factory floor. Employment of industrial machinery mechanics, machinery maintenance workers and millwrights is projected to grow 14%, or about 78,900 jobs, and 51% of these workers are employed in manufacturing. Industrial machinery mechanics alone are projected to grow 18%, from 446,900 jobs to 526,600, adding about 79,700. BLS ties that demand directly to the continued adoption of automated manufacturing machinery and automated conveyors that need regular care.
The same BLS table shows how the work is shifting inside those numbers. Machinery maintenance workers, who handle basic upkeep, are projected to decline 2% as industrial machinery mechanics absorb those tasks, and predictive maintenance makes scheduling more efficient. Growth is also uneven across automation-adjacent titles: electro-mechanical and mechatronics technologists and technicians are projected to grow 3%, about the economy-wide average.
Software has also become part of the industrial picture, though these figures cover the whole economy. Software developers are projected to add about 174,700 jobs, one of the largest gains of any occupation, and the broader group of software developers, quality assurance analysts and testers is projected to grow 10%. BLS names continued software development for AI, the Internet of Things, robotics and other automation applications as one source of that demand. Most of those jobs will sit outside manufacturing, which means manufacturers hiring for controls software, MES, or industrial data work compete with every other industry for the same people.
A more automated economy still requires a lot of people, and these projections show more of that demand shifting toward the people who install, maintain, connect, optimize and improve the technology. They are projections of direction, and BLS itself cautions that the precise values carry real uncertainty, so they fall short of forecasting an unprecedented employment boom.
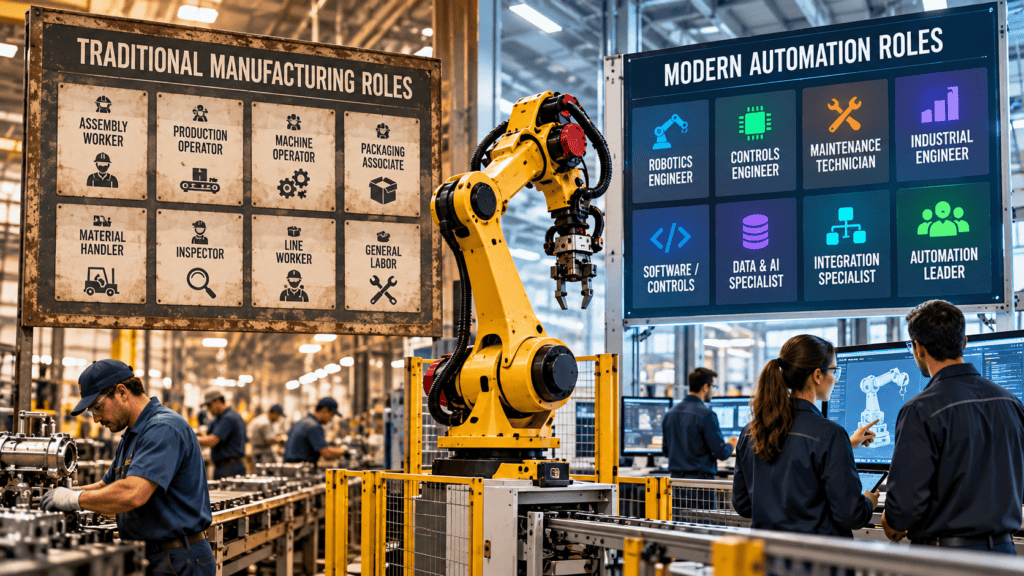
The next workforce challenge crosses traditional job descriptions
Manufacturers still need specialists. A controls engineer, maintenance technician, software developer, and manufacturing engineer bring different expertise, and trying to turn every technical employee into a generalist would create its own problems.
The overlap between those specialties is growing. Controls engineers increasingly encounter industrial networks, databases, and cybersecurity. Maintenance teams use telemetry, condition monitoring and predictive maintenance tools. Manufacturing engineers find themselves working with robotics, vision and production data alongside the process knowledge they have always needed.
Senior automation positions can be even harder to define. A leader may need enough controls knowledge to evaluate PLC architecture, enough robotics experience to understand several platforms, enough manufacturing experience to understand throughput and downtime, and enough industrial IT knowledge to work across networks, data and system integration. AI, simulation, manufacturing execution systems (MES), digital twins, and cybersecurity can broaden that responsibility even further. Rockwell’s 2025 survey recorded a 5% rise in the importance manufacturers place on analytical and AI skills for their leaders.
In that environment, job titles become unreliable recruiting filters. An Automation Director at one manufacturer may have experience that closely resembles an Advanced Manufacturing Engineering Director, Controls Manager, or Robotics Engineering Manager somewhere else. What someone has actually built, integrated, scaled, and kept running often tells you more than the title on the business card.
More automation puts a higher price on uptime
As automation density rises, more of the economics move toward keeping an interconnected production system available. The support list from earlier grows here: a plant with a large automation footprint manages software and firmware, networks and remote access alongside the preventive maintenance, spare parts, backups, vendor support and recovery procedures the equipment itself requires.
Siemens’ 2024 True Cost of Downtime report, based on a survey of 181 maintenance, engineering and IT professionals at large industrial companies, estimated that an hour of lost production at a large automotive plant costs roughly $2.3 million, compared with about $36,000 in fast-moving consumer goods. Across the world’s 500 largest companies, Siemens put annual losses from unplanned downtime near $1.4 trillion, about 11% of revenue. Those are industry estimates, and the roughly 60-fold gap between sectors shows why downtime has to be evaluated in context.
An inexpensive component can create a very expensive production problem if it sits at the wrong point in the process. A failed sensor or communication fault may take an entire cell offline, and a constrained cell can affect production far beyond the price of whatever failed.
Factories with more automation consequently need people who can find problems quickly, understand how systems interact, and restore production. Equipment availability, mean time to repair (MTTR), overall equipment effectiveness (OEE), spare-parts strategy and recovery procedures remain part of the economics long after the original capital project is approved.
The smart factory makes the technology stack wider
Robotics no longer sits comfortably in its own technical silo. A production issue might originate in a robot program, PLC handshake, machine vision system, sensor, industrial network, MES transaction, database, safety event, or upstream material problem. Finding the cause can require several disciplines to understand how their systems interact.
Standards are helping reduce some of that friction. OPC UA provides standardized ways for industrial equipment and higher-level systems to exchange information. VDA 5050, now at version 3.0.0, addresses communication between mobile robots and fleet-control systems. Neither one turns a factory full of equipment from different vendors and generations into a single uniform technology platform.
AI and digital twins widen the stack again. Machine vision can improve inspection and let robots work with more variable inputs. Simulation gives engineers ways to test some changes before interrupting production. Digital twins combine physical equipment, simulation models, sensors, and operating data to study how a system behaves and how it may respond when conditions change.
From outside manufacturing, these technologies can look like separate trends. Inside a factory, they increasingly meet at the same production process.
The published data is probably behind the conversations already happening
Robot installation data tell us what companies have already deployed. Employment statistics describe what has happened in the labor market or what economists can reasonably project from observable trends. Neither tells us how many plants are evaluating automation today or how many executive teams are reconsidering the labor model for a facility not yet built.
The reporting lag is built in. IFR released its full 2025 figures on September 24, 2026, nearly nine months after the year closed. A robot counted as a 2026 installation may have started as an operating problem years earlier: the company had to study that problem, evaluate the economics, find capital, choose vendors, design the application, and get it installed.
No comparable public dataset exists for the earlier conversations. We cannot count how many plant managers are asking whether another shift can realistically be staffed, how many CFOs are comparing repeated turnover with a capital investment, or how many leadership teams are considering automated inspection because quality variation has become too expensive. The same blind spot applies to companies designing a new plant around a different mix of people and automation. Some of the most consequential automation decisions being discussed today will not appear in robot installation statistics for another year or two, and we may eventually look back at five million industrial robots as a milestone somewhere in the middle of this growth story.
We are hearing more of those conversations ourselves
At STEM Search Group, we have seen a noticeable increase over the past two years in conversations involving smart factories, Industry 4.0, AI and robotics, digital twins, and the people needed to make those investments work. That increase has been especially noticeable in 2026.
The recruiting problems coming out of those discussions often cross the job categories companies have traditionally used. A digital twin project might touch simulation, robotics, sensors, controls, data engineering and manufacturing operations. A smart factory initiative can bring PLCs and industrial networks into the same conversation as MES, software and data. AI and robotics projects eventually reach production, where uptime, safety and integration become part of the technical problem.
We also hear the labor specifics that national statistics can’t show: which positions an employer keeps refilling, which openings create overtime, where supervisor time disappears into interviewing and training, and which processes produce recurring safety, ergonomic or quality problems. Those experiences influence automation decisions even when they never appear in an industry report.
For manufacturers building more automated operations, that shapes how we recruit. As a direct-hire recruiting firm working coast to coast, STEM Search Group starts with the operating problem before deciding what title to search for: what does the company need this person to build, integrate, improve, scale, or keep running? The answer usually tells us more about the controls engineers, automation leaders, and maintenance specialists a plant needs than any list of keywords on a job description.
Sources
- International Federation of Robotics: Five Million Robots now Operate in Factories Globally, World Robotics 2026
- International Federation of Robotics: World Robotics 2026, United States
- International Federation of Robotics: World Robotics 2026, European Union
- International Federation of Robotics: Global Robot Demand in Factories Doubles Over 10 Years
- International Federation of Robotics: Advances in Programming Lower Cost of Adoption
- Association for Advancing Automation: Robot Orders Grow 6.6% in 2025 as General Industries Drive Broader Automation Adoption
- Association for Advancing Automation: A3 Robotics Statistics
- NIST: Best Practices for the Integration of Collaborative Robots into Workcells Within Small and Medium-Sized Manufacturing Operations
- U.S. Bureau of Labor Statistics: Industrial Machinery Mechanics, Machinery Maintenance Workers, and Millwrights
- U.S. Bureau of Labor Statistics: Industrial Engineers
- U.S. Bureau of Labor Statistics: Electrical and Electronics Engineers
- U.S. Bureau of Labor Statistics: Software Developers, Quality Assurance Analysts, and Testers
- Rockwell Automation: 10th Annual State of Smart Manufacturing Report
- OSHA: The Control of Hazardous Energy, Lockout/Tagout
- OSHA: Hazardous Energy from Interconnected or Nearby Machines or Equipment
- Siemens: The True Cost of Downtime 2024
- OPC Foundation: OPC UA for Robotics, Part 1
- idealworks: VDA 5050 Version 3.0.0 Release
- Material Handling 24/7: IFR Record of 4 Million Robots in Factories Worldwide (World Robotics 2024)
- Business Wire: New World Robotics 2021, International Federation of Robotics Reports
- U.S. Bureau of Labor Statistics: Mechanical Engineers
- U.S. Bureau of Labor Statistics: Electro-mechanical and Mechatronics Technologists and Technicians
- U.S. Bureau of Labor Statistics: Electrical and Electronics Engineers
- U.S. Bureau of Labor Statistics: Industrial Machinery Mechanics, Machinery Maintenance Workers, and Millwrights